Modern software systems are complex beasts. Microservices, containers, serverless functions, distributed databases—each layer adds another dimension of potential failure. Traditional monitoring tools tell you when something breaks. Observability tells you why. That difference matters more than most teams realize until they're drowning in alerts at 3 AM with no clear path to resolution.
The shift from monolithic applications to distributed architectures fundamentally changed how we need to understand system behavior. You can't just check CPU and memory anymore. You need to see how a request flows through dozens of services, how data transforms at each step, and where latency creeps in. That's what observability gives you.
Understanding Observability in Modern Software
What is observability in software? At its core, observability measures your ability to understand a system's internal state by examining the data it produces externally. The term originates from control theory, describing systems whose internal conditions can be inferred through their external signals and outputs.
In practical software terms, this means instrumenting your applications and infrastructure to emit detailed, structured data about their behavior. Then building the capability to query that data in flexible ways. You're not just collecting metrics—you're creating a complete picture of system state that lets you investigate unknown problems.
The shift to distributed architectures makes this capability essential now. A monolithic application might have a dozen failure scenarios you can anticipate and prepare for. A system with 50 microservices introduces thousands of potential interaction failures. Many won't occur to you until they're actively causing problems.
The pattern I see most often is teams trying to predict every possible failure and creating dashboards for each one. This doesn't scale. You end up with alert fatigue and still miss novel issues. Observability flips this approach—instead of predicting failures, you build the capability to investigate any failure when it occurs.
Modern cloud-native applications demand this shift. When services scale automatically, when containers die and respawn, when traffic patterns shift unpredictably, you need real-time insight into actual behavior. Static dashboards can't keep up.
Observability is about being able to ask arbitrary questions of your systems without having to predict those questions in advance or ship new code to answer them.
— Majors Charity
Observability vs Monitoring
People often use these terms interchangeably. They shouldn't. Monitoring and observability serve different purposes and require different approaches. Understanding the distinction helps you build the right strategy for your systems.
Monitoring is about watching known failure states. You identify key metrics (CPU, memory, error rates), set thresholds, and get alerted when those thresholds breach. It answers predetermined questions: "Is the disk full?" "Is the API response time above 500ms?" "Did the deployment succeed?"
Observability is about exploring unknown failure states. It gives you the raw material to ask questions you didn't anticipate. "Why did this specific user's checkout fail?" "What changed in the last hour that caused this latency spike?" "Which service in the chain is causing this intermittent error?"
Author: Damien Crowhurst;
Source: aleanetwork.net
Here's the key difference: monitoring tells you what is broken. Observability helps you understand why it's broken and how to fix it.
Feature
Monitoring
Observability
Primary goal
Detect known problems and track system health
Investigate unknown problems and understand system behavior
Data approach
Predefined metrics and thresholds
Rich, high-cardinality data for exploratory analysis
Question types answered
"Is X broken?" "Did Y exceed threshold?"
"Why is this happening?" "What caused this behavior?"
System knowledge required
Must predict failure modes in advance
Can investigate novel failures without prior knowledge
Best for
Stable systems with known failure patterns
Dynamic, distributed systems with emergent behaviors
Key Differences in Practice
Let's make this concrete. You're running an e-commerce site. Your monitoring system tracks overall checkout success rate. It drops from 99% to 95%. Alert fires. Now what?
With just monitoring, you know there's a problem. You don't know which step in checkout is failing, which user segments are affected, or what changed to cause it. You start digging through logs manually, checking each service, restarting things hoping it helps.
With observability, you can immediately query: "Show me all failed checkout attempts in the last 10 minutes." Then drill into a specific failed transaction. You see it timed out calling the payment service. You trace that request through the payment service and discover it's waiting on a third-party fraud check API that started responding slowly. You can even see that only transactions from a specific region are affected because they route through a particular fraud check endpoint.
Same problem. Vastly different time to resolution.
When to Use Each Approach
You don't choose one or the other exclusively. Most teams need both. But the balance shifts based on your system's characteristics.
Monitoring works great for:
Infrastructure health checks (disk space, memory, network)
Known business metrics (orders per minute, revenue, user signups)
Compliance and SLA tracking
Simple, stable systems with predictable failure modes
Observability becomes necessary when:
You're running distributed systems with many interdependencies
Failures are unpredictable and context-dependent
You need to debug production issues quickly
Your system changes frequently (multiple deployments per day)
User experience varies based on complex factors
A common mistake is thinking you can skip monitoring once you have observability. You can't. Monitoring provides the early warning system. Observability provides the investigation tools. They're complementary.
The Three Pillars of Observability
The industry has coalesced around three core data types that form the foundation of observability: metrics, logs, and traces. Each pillar provides a different lens into system behavior. Combined, they offer comprehensive visibility into what's happening across your infrastructure.
This framework isn't arbitrary. These three data types naturally emerge from how systems communicate and fail. They complement each other's weaknesses and reinforce each other's strengths.
Pillar
Purpose
Example Use Cases
Metrics
Quantify system behavior over time with aggregated numerical data
Capture discrete events with contextual details about what happened
Debug specific errors, audit user actions, investigate security incidents, understand business logic flow
Traces
Map the path of requests across distributed services
Identify bottlenecks in multi-service transactions, understand service dependencies, measure end-to-end latency
Metrics
Metrics are numerical measurements collected at regular intervals. Think of them as time-series data: request count per second, CPU percentage, memory usage, error rate. They're cheap to collect and store because they're aggregated.
Metrics excel at showing trends and patterns. You can rapidly determine whether your request volume is climbing or if error rates spiked after a deployment. They're perfect for dashboards and alerting because they're lightweight and fast to query.
But metrics have limitations. They lose detail through aggregation. If your average response time is 200ms, that doesn't tell you about the 1% of requests taking 10 seconds. High-cardinality data (like user IDs or transaction IDs) makes metrics expensive and unwieldy.
Modern metrics systems use dimensional data—labels or tags that let you slice metrics by attributes like service name, region, or customer tier. This adds flexibility without the cost of logging every individual event.
Logs
Each log entry represents a discrete event: "User 12345 clicked checkout", "Payment API returned 500 error", "Database query took 2.3 seconds". Log entries contain rich contextual information but become expensive to store and search at scale.
Logs are your go-to for debugging specific issues. When something goes wrong, you want to see exactly what happened, in order, with all the details. Logs give you that narrative.
The challenge with logs is volume. A busy application generates millions of log lines per hour. Storing and searching all of them gets expensive fast. Teams often sample logs or set retention policies, which means you might not have the log you need when investigating an old issue.
Structured logging helps. Instead of free-text messages, emit logs as JSON with consistent fields. This makes them searchable and lets you extract metrics from log data when needed.
Author: Damien Crowhurst;
Source: aleanetwork.net
Traces
Traces follow a single request as it flows through your distributed system. Each service the request touches adds a span to the trace, recording what it did and how long it took. When you stitch all the spans together, you get a complete picture of the request's journey.
Distributed tracing is relatively new compared to metrics and logs, but it's become critical for understanding microservices. Without traces, debugging a slow API call that touches 10 services is nearly impossible. You're stuck checking each service's logs separately, trying to correlate timestamps.
Traces show you the full request path, where time was spent, and which service caused an error. They make the invisible visible. You can see that 80% of your request latency comes from a single database query in a downstream service you didn't even know existed.
The tricky part is instrumentation. Every service needs to propagate trace context (a trace ID and span ID) to downstream services. This requires either manual instrumentation or automatic agents. Many modern frameworks now include trace support out of the box.
How Full Stack Observability Works
Full stack observability extends the three pillars across every layer of your technology stack. From the user's browser to your application code to your infrastructure and cloud services. The goal is end-to-end visibility into how your entire system behaves as a cohesive whole.
Think about a typical web application. A user clicks a button. That triggers JavaScript in their browser, which sends an API request. The request hits your load balancer, routes to an application server, which queries a database and calls two microservices, one of which makes an external API call. Each layer can fail or slow down. Full stack observability lets you see all of it.
This requires instrumentation at every level:
Frontend observability captures user interactions, page load times, JavaScript errors, and browser performance. Real user monitoring captures the actual experience your users have, contrasting with synthetic tests that only show ideal-case scenarios. You can see that users in a specific region are experiencing slow page loads because a CDN node is degraded.
Application observability instruments your code to emit metrics, logs, and traces. This is where most teams start. You track request rates, error rates, latency distributions. You log important business events. You trace requests through your services. Application Performance Monitoring (APM) tools often focus on this layer.
Infrastructure observability monitors your servers, containers, databases, message queues, and cloud services. You need to know when a container crashes, when a database connection pool is exhausted, when network latency increases between availability zones.
Business observability links technical metrics directly to business outcomes. You don't just track API response times—you track how response times affect conversion rates. You correlate deployment times with customer churn. This creates a shared language between engineering teams and business stakeholders.
The real power comes from correlating data across layers. When a user reports a problem, you can trace their specific session from frontend through backend to infrastructure. You see that their request hit a specific application server that was experiencing high CPU because a database query was slow because a disk was nearly full.
Most teams don't start with full stack observability. They begin with one layer (usually application) and expand over time. That's fine. Just architect your observability platform to support adding layers later.
Author: Damien Crowhurst;
Source: aleanetwork.net
Observability Platform Components
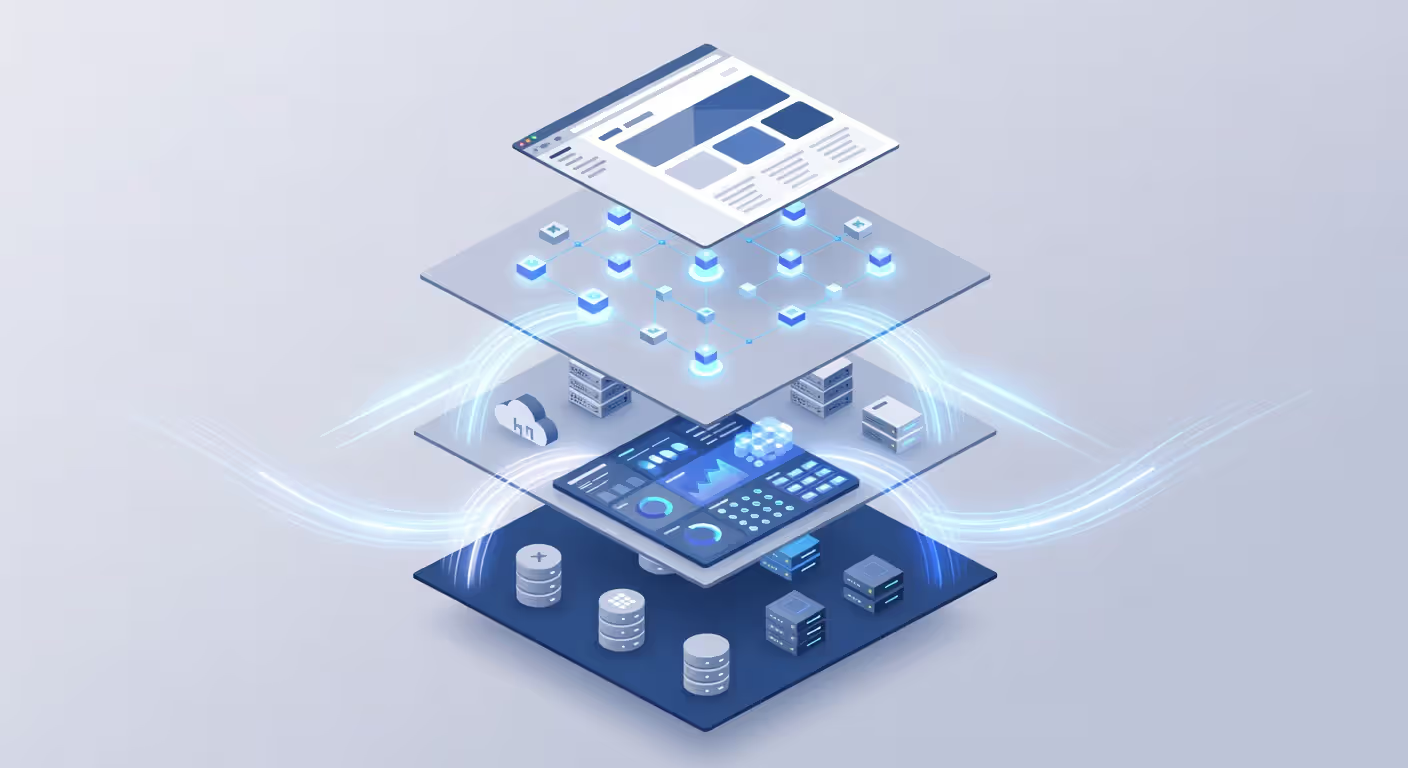
An observability platform isn't a single tool—it's a collection of components working together to collect, store, analyze, and visualize telemetry data. Understanding these components helps you evaluate solutions and build the right architecture for your needs.
Data collection is the foundation. You need agents, libraries, or SDKs to gather metrics, logs, and traces from your applications and infrastructure. This includes instrumentation libraries that you add to your code, agents that run alongside your applications, and collectors that receive and forward telemetry data.
Modern collection often uses OpenTelemetry, an open standard for telemetry data. It provides consistent APIs and SDKs across languages, letting you instrument once and send data to multiple backends. This avoids vendor lock-in and simplifies instrumentation.
Data storage is where cost and performance trade-offs get real. Time-series databases handle metrics efficiently. Log storage needs to handle high write volumes and fast text search. Trace storage requires specialized indexing to reconstruct request paths quickly.
Many platforms use different storage backends optimized for each data type. Some use a unified store that handles all three. The choice affects your query performance, retention costs, and scaling characteristics.
Data processing happens between collection and storage. You might sample traces to reduce volume, aggregate metrics to reduce cardinality, or enrich logs with additional context. Processing pipelines let you filter, transform, and route data before it hits storage.
This is where you make decisions about data retention, sampling rates, and what to keep versus discard. A common pattern is to keep high-resolution data for recent time periods (last 24 hours) and downsample or discard older data.
Analysis and querying tools let you explore your data. You need a query language to slice and dice metrics, search logs, and visualize traces. The best platforms let you move fluidly between data types—click on a metric spike, see the logs from that time period, drill into a specific trace.
Query performance matters. If it takes 30 seconds to run a query, you can't iterate quickly during an incident. Sub-second query response times let you explore hypotheses rapidly.
Visualization and dashboards present your data in understandable formats. Time-series graphs for metrics, log viewers with search and filtering, flame graphs and waterfall charts for traces. Dashboards give you at-a-glance system health. Exploration interfaces let you dig deeper.
Alerting and automation closes the loop. When your analysis detects problems, you need to notify the right people and potentially trigger automated responses. Modern alerting goes beyond simple threshold checks—it uses anomaly detection, trend analysis, and correlation to reduce false positives.
The simpler option usually wins here. Many teams over-engineer their observability platform early on. Start with the components you need today. Add complexity as your scale and requirements grow.
Observability Tools and Implementation
The observability tools landscape is crowded and constantly evolving. You've got commercial platforms, open-source projects, cloud provider solutions, and specialized tools for specific data types. Choosing the right combination depends on your team size, budget, technical constraints, and existing infrastructure.
Commercial platforms offer integrated solutions that handle all three pillars plus storage, analysis, and visualization. They're expensive but reduce operational overhead. You don't manage infrastructure or worry about scaling. The trade-off is vendor lock-in and potentially limited customization.
Most commercial vendors price their services according to how much data you ingest or how long you store it. Costs can spiral quickly if you're not careful about what data you send and how long you keep it. Budget for 2-3x your initial estimates—observability data grows faster than you expect.
Open-source tools give you more control and flexibility. Prometheus for metrics, Elasticsearch or Loki for logs, Jaeger or Tempo for traces. You can run them yourself or use managed versions. The upside is no per-GB pricing. The downside is operational complexity—you're now running an observability platform instead of just using one.
Many teams start with open-source and migrate to commercial platforms as they scale. The operational burden of running Elasticsearch clusters at scale isn't trivial. Know what you're signing up for.
Cloud provider observability services integrate naturally with cloud infrastructure. AWS CloudWatch, Azure Monitor, Google Cloud Operations—they automatically collect metrics from cloud services and make integration straightforward. But they often lag behind specialized observability platforms in query capabilities and cross-service correlation.
A hybrid approach works well: use cloud provider tools for infrastructure observability, specialized platforms for application observability.
Implementation considerations matter as much as tool selection. Begin by instrumenting your most critical services—the ones that generate revenue or cause the most customer pain. You don't need complete instrumentation across every service immediately.
Standardize on instrumentation patterns. Create libraries or templates that make it easy for developers to add observability to new services. If every team instruments differently, you can't correlate data across services.
Think about data ownership and access. Who can see production data? How do you handle sensitive information in logs and traces? Implement filtering and redaction early—it's harder to add later.
Plan for data growth. Observability data volume grows faster than application traffic. A 10x increase in requests might mean a 20x increase in telemetry data. Build in sampling, retention policies, and cost controls from the start.
Don't boil the ocean. Many observability initiatives fail because teams try to instrument everything at once, integrate too many tools, and build complex analysis pipelines before they've proven the basic value. Start small. Show value. Expand incrementally.
Common Observability Challenges and Solutions
Author: Damien Crowhurst;
Source: aleanetwork.net
Implementing observability sounds great in theory. In practice, teams hit predictable obstacles. Here are the ones I see repeatedly, with practical approaches that actually work.
Challenge: Overwhelming data volume and cost. You start sending all your logs and traces to an observability platform. Three months later, your bill is 10x what you budgeted. Data volume is the number one reason observability projects get scaled back or cancelled.
Solution: Implement intelligent sampling from day one. You don't need every trace—sample at 1% or 5% for normal traffic, 100% for errors. Use tail-based sampling that keeps interesting traces (slow requests, errors, rare paths) and discards routine ones. For logs, log at different levels in different environments. Debug logs in development, info or warning in production. Set retention policies that keep high-resolution data for days or weeks, aggregated data for months.
Challenge: Alert fatigue and noise. You set up observability, create dashboards, configure alerts. Soon your team is drowning in notifications. Most are false positives or low-priority issues. Critical incidents become difficult to spot among the constant stream of notifications.
Solution: Be ruthless about alert quality. Every alert should be actionable—something a human needs to respond to right now. Alerts that don't demand immediate response belong on dashboards, not in notification channels. Deploy anomaly detection rather than relying solely on static thresholds. Consolidate related alerts to prevent notification storms during cascading failures. Implement on-call rotation so alert fatigue is distributed.
Challenge: Lack of adoption by development teams. You build an observability platform, but developers don't use it. They still debug by adding print statements and redeploying. Your expensive platform sits mostly idle.
Solution: Make observability part of the development workflow, not a separate operations concern. Show developers how observability helps them debug faster. Build instrumentation into starter templates and frameworks so it's easier to include than exclude. Celebrate wins—when someone uses observability to quickly fix a production issue, share that story. Provide training and examples. Make it easy.
Challenge: Inconsistent instrumentation across services. Different teams instrument differently. Some services emit detailed traces, others barely log anything. Correlation across services is impossible because everyone uses different field names and formats.
Solution: Establish instrumentation standards early. Create shared libraries that enforce consistent patterns. Use OpenTelemetry to standardize on data formats. Implement automated checks that verify services meet minimum instrumentation requirements before deploying to production. Make instrumentation a part of your code review process.
Challenge: Difficulty connecting technical metrics to business impact. Engineers see that API latency increased. Business stakeholders ask "So what? How does that affect revenue?" You can't connect the dots.
Solution: Instrument business metrics alongside technical metrics. Track not just request rates but conversion rates, order values, user engagement. When you alert on technical issues, include business context: "API latency increased 200ms, estimated impact: $5K/hour in lost conversions." This makes prioritization decisions clearer and justifies investment in observability.
Challenge: Observability for legacy systems. Your modern microservices are fully observable. Your monolithic legacy application that handles 60% of your revenue? Not so much. It wasn't built with observability in mind.
Solution: You can't rewrite everything, but you can incrementally improve. Start with black-box observability—instrument at the edges (load balancers, databases, external APIs). Add structured logging without changing business logic. Use proxy or sidecar patterns to capture traffic without modifying application code. When you do touch legacy code, add instrumentation as you go. Progress beats perfection.
FAQ: Observability Questions Answered
What is the difference between observability and monitoring?
Monitoring focuses on tracking known failure states using predefined metrics and thresholds. It tells you what is broken by watching for specific conditions you've anticipated. Observability provides the raw data and tools to investigate why something is broken, even if you didn't predict that specific failure mode. Monitoring answers predetermined questions; observability lets you ask new questions of your system without deploying new code. You need both—monitoring for early detection, observability for investigation and resolution.
Do I need all three pillars of observability?
You can start with one or two pillars, but you'll eventually need all three for comprehensive system understanding. Metrics give you the big picture and alert you to problems. Logs provide detailed context about what happened. Traces show how requests flow through distributed systems. Each pillar has blind spots that the others cover. For example, metrics might show increased latency, logs might reveal error messages, but only traces show which specific service in your chain is causing the slowdown. Start with what's most valuable for your immediate needs, then expand.
How much does an observability platform cost?
Costs vary wildly based on data volume, retention, and whether you choose commercial platforms or self-hosted open-source tools. Commercial platforms typically charge $1-5 per GB of data ingested, which can range from a few hundred dollars monthly for small applications to hundreds of thousands for large-scale systems. Open-source solutions trade licensing costs for operational overhead—you'll need staff time to run and maintain the platform. Budget for observability to cost 2-5% of your infrastructure spend. Implement sampling and retention policies from day one to control costs.
Can I build observability into legacy systems?
Yes, though it requires different approaches than greenfield applications. Start with external instrumentation—monitor at boundaries like load balancers, databases, and external API calls. Add structured logging to existing log statements without changing business logic. Use proxy or sidecar patterns to capture traffic and generate traces without modifying application code. Gradually add deeper instrumentation when you touch code for other reasons. You won't get the same depth as a purpose-built observable system immediately, but you can make meaningful improvements without a full rewrite.
What skills does my team need for observability?
Your team needs a mix of instrumentation knowledge, data analysis skills, and system thinking. Developers should understand how to add metrics, logs, and traces to code using libraries like OpenTelemetry. Someone needs to understand the observability platform itself—how to write queries, build dashboards, and configure alerts. Most importantly, you need people who can think systematically about distributed systems and use observability data to form and test hypotheses during incidents. Many teams train existing engineers rather than hiring specialists. The tooling is learnable; the investigative mindset is what matters most.
How is observability different from APM (Application Performance Monitoring)?
APM tools focus specifically on application-layer performance—request rates, response times, error rates, and code-level profiling. They're a subset of observability. Observability is broader, covering infrastructure, business metrics, user experience, and providing more flexible data exploration. Traditional APM tools often use predefined dashboards and limited query capabilities. Modern observability platforms let you ask arbitrary questions and correlate data across your entire stack. That said, many APM vendors have expanded to offer full observability capabilities, and the lines have blurred. Focus on the capabilities you need rather than the category label.
Observability isn't a project with an end date—it's a practice that evolves with your systems. Start small, prove value, and expand incrementally. Instrument your most critical services first. Show how faster incident resolution saves money and reduces stress. Build momentum through quick wins.
The teams that succeed with observability treat it as a core engineering practice, not an operations afterthought. They make instrumentation part of their definition of done. They use observability data to drive architectural decisions and prioritize improvements. They invest in the practice because they've seen the alternative: flying blind in complex systems, spending hours or days debugging issues that should take minutes.
Your systems will only get more complex. Observability is how you maintain control and understanding as that complexity grows. The investment you make today pays dividends every time you avoid a prolonged outage or quickly resolve a customer-impacting issue. Start now. Your future self will thank you.
Containerization packages applications with their dependencies into lightweight, portable units. This comprehensive guide explains how containers work, compares them to virtual machines, covers Docker and orchestration platforms, and shows you how to implement container-based deployment in modern DevOps workflows.
Performance monitoring tools track application response times, server health, and infrastructure metrics to catch problems before users notice. This guide covers how monitoring works, types of tools available, key features to evaluate, and common implementation mistakes to avoid.
An API platform is the complete ecosystem that handles routing, security, lifecycle management, and governance for your APIs. Understand the core components—gateway, manager, portal, analytics—and learn how to evaluate platforms based on scalability, developer experience, and integration capabilities.
Comprehensive guide to test automation for QA teams. Covers automation frameworks, popular testing tools comparison, best practices for maintainable test suites, continuous testing in CI/CD pipelines, and common mistakes to avoid when implementing automated testing strategies.
The content on this website is provided for general informational and educational purposes only. It is intended to explain concepts related to AI tools, agents, developer infrastructure, coding assistants, APIs, and productivity workflows.
All information on this website, including articles, guides, and examples, is presented for general educational purposes. Outcomes and tool performance may vary depending on implementation, skill level, and use case.
This website does not provide professional AI consulting, development services, or guarantees of results, and the information presented should not be used as a substitute for consultation with qualified AI or software development professionals.
The website and its authors are not responsible for any errors or omissions, or for any outcomes resulting from decisions made based on the information provided on this website.