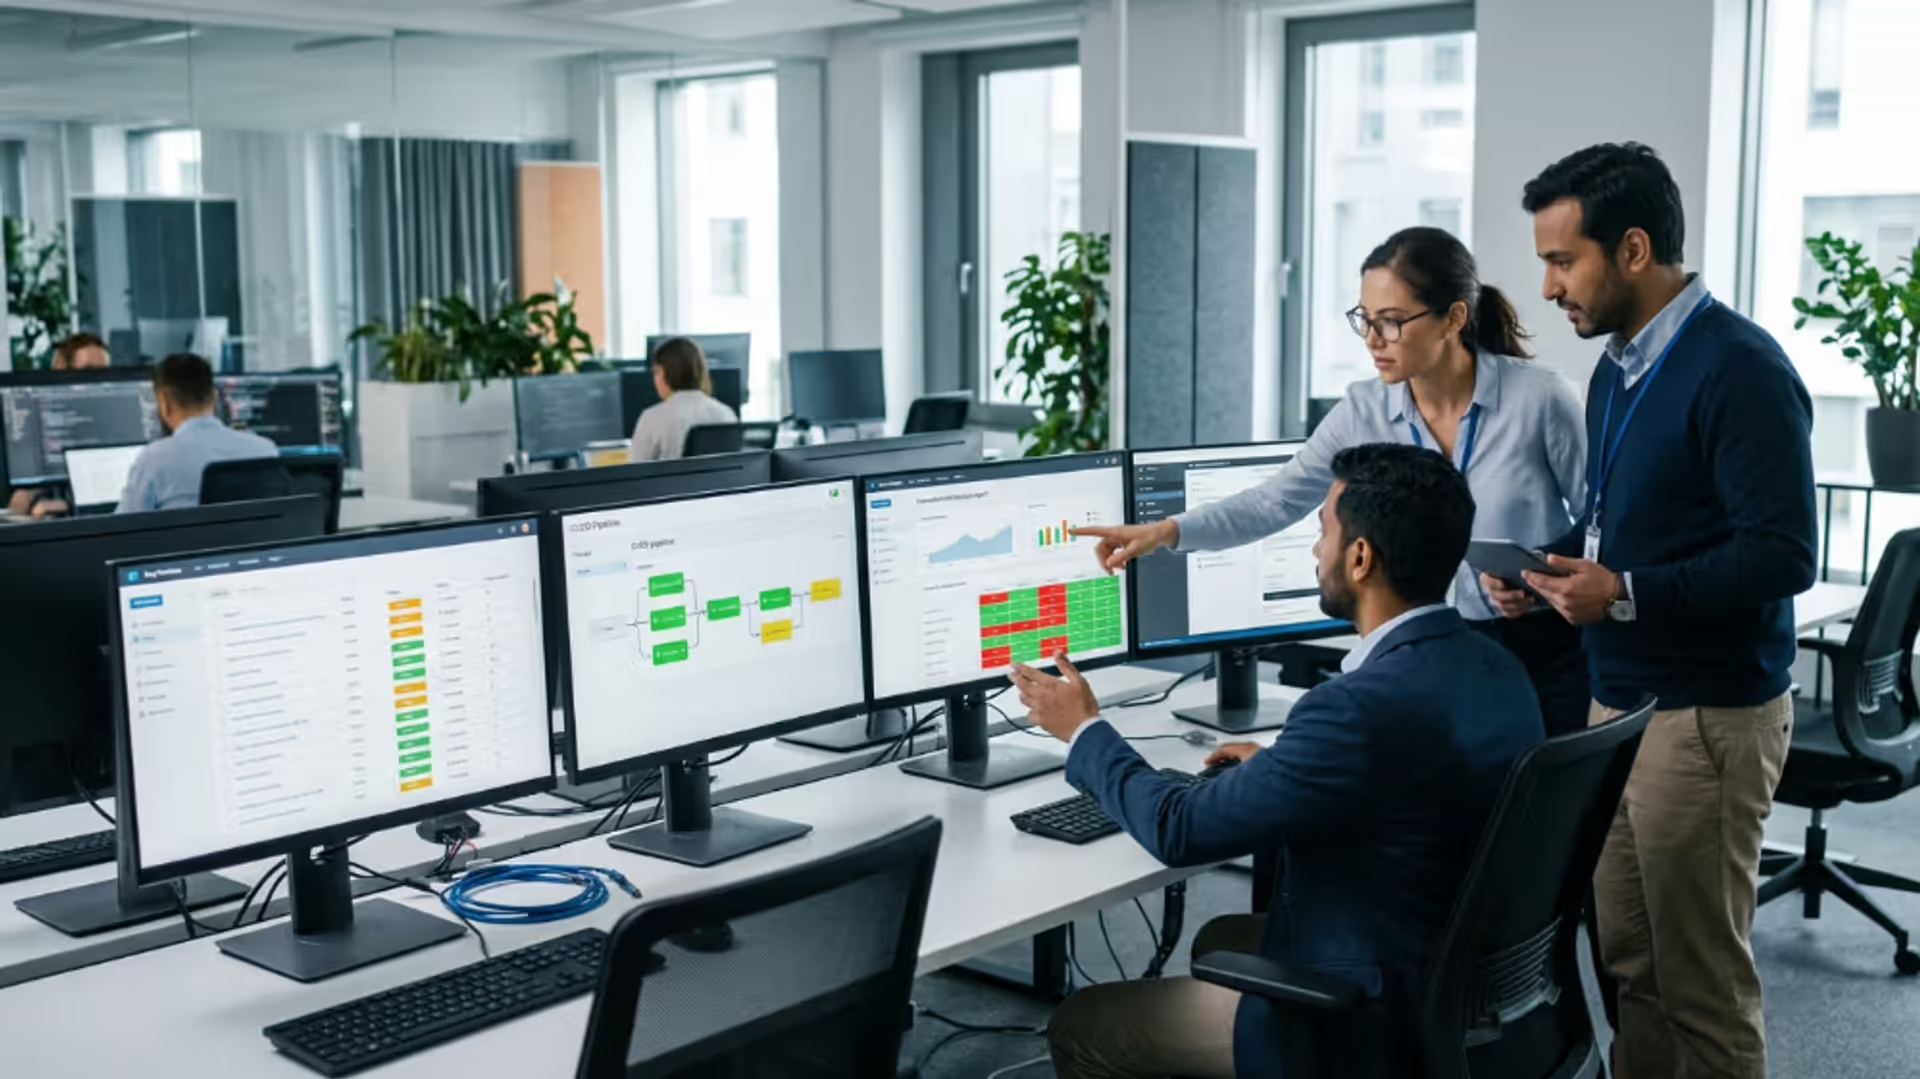
Performance monitoring isn't optional anymore. When your application slows down or crashes, you're not just losing uptime—you're losing revenue, users, and trust. The right performance monitoring tools give you visibility into what's happening across your entire stack before problems spiral out of control.
But here's the thing: choosing the wrong tool or implementing it poorly can create more noise than insight. You'll end up drowning in metrics that don't matter while missing the signals that do. This guide walks you through what performance monitoring tools actually do, how to pick the right ones, and how to avoid the mistakes that trip up most teams.
What Are Performance Monitoring Tools
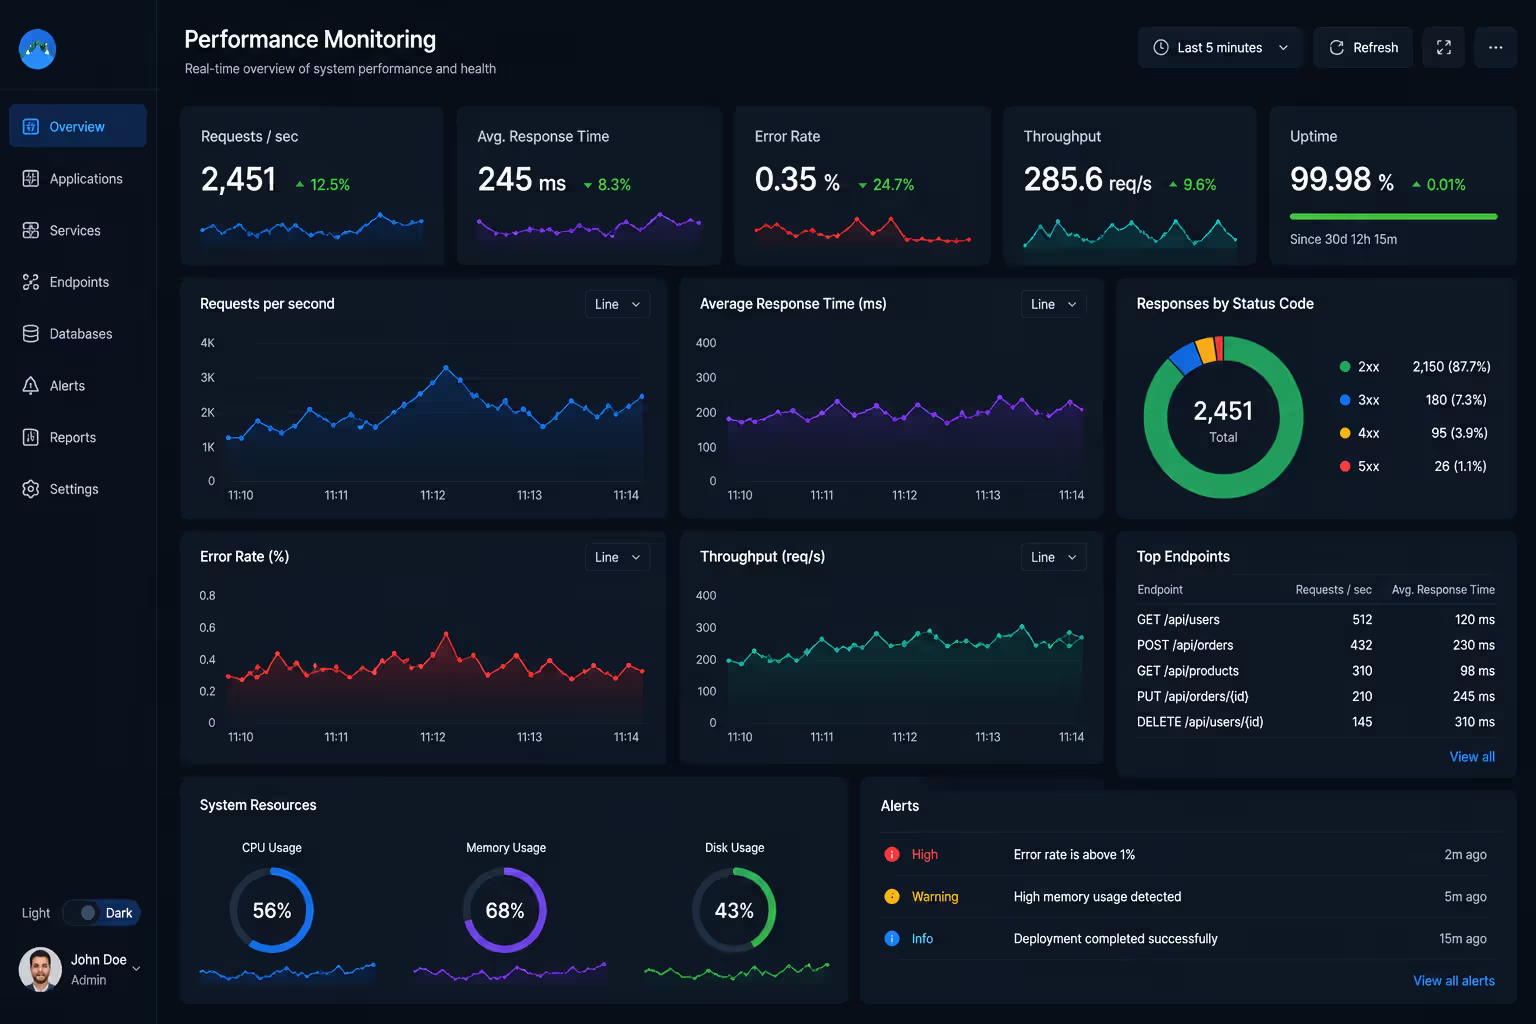
Performance monitoring tools are software solutions that continuously track, measure, and analyze how your applications, servers, and infrastructure are performing. They collect data points like response times, error rates, CPU usage, memory consumption, and network latency to help you understand system health in real time.
These tools don't just watch your systems—they help you spot patterns, identify bottlenecks, and predict failures before users notice anything wrong. Application performance management (APM) platforms track how code executes, where database queries slow down, and which API calls are causing problems. Performance monitoring software extends this visibility to every layer of your stack.
Modern tools track four main areas: application behavior (how your code performs), server health (CPU, memory, disk I/O), infrastructure metrics (network throughput, container resource usage), and user experience (page load times, transaction completion rates). The best ones correlate data across these layers so you can trace a slow checkout process back to a specific database query or a misconfigured load balancer.
Most platforms use agents—small programs installed on your servers or embedded in your application code—to collect this data. They send metrics, logs, and traces to a central dashboard where you can visualize trends, set up alerts, and dig into issues when they occur.
Author: Damien Crowhurst;
Source: aleanetwork.net
How Performance Monitoring Works
Performance monitoring relies on three types of data: metrics, logs, and traces. Metrics are numerical measurements taken at regular intervals—things like CPU percentage, request counts per second, or average response time. Logs are timestamped records of events that happened in your system. Traces follow a single request through your entire application stack, showing exactly where time was spent.
There are two main collection approaches. Agent-based monitoring installs lightweight programs on your servers or within your application runtime. These agents gather data locally and send it to your monitoring platform. Agentless monitoring uses network protocols, API calls, or synthetic tests to observe your systems from the outside without installing anything.
Agent-based approaches give you deeper visibility—they can see memory allocation patterns, thread counts, and internal application metrics that external tools can't access. The tradeoff? You have to install and maintain agents across your infrastructure. Agentless monitoring is simpler to set up but gives you a more limited view, usually focused on availability and response times rather than internal behavior.
Real-time monitoring processes data as it arrives, triggering alerts within seconds when thresholds are breached. Historical analysis stores weeks or months of data so you can spot trends, compare current performance against baselines, and investigate issues that happened in the past. You need both. Real-time catches fires; historical helps you understand why they started.
Most modern platforms use time-series databases optimized for storing millions of data points per second. They aggregate older data to save space—keeping every individual metric from three months ago isn't practical or useful. Instead, they'll store averages, maximums, and percentiles that let you see patterns without drowning in raw data.
Types of Performance Monitoring Software
Application Performance Monitoring
Application performance monitoring focuses specifically on how your software behaves in production. APM tools instrument your code to track transaction times, database query performance, external API calls, error rates, and code-level execution paths.
These platforms excel at distributed tracing—following a single user request as it bounces between microservices, databases, caching layers, and third-party APIs. When a checkout process takes 8 seconds instead of 2, APM tools show you exactly which service call added the delay.
Modern APM solutions support multiple programming languages and frameworks. They auto-detect common libraries and frameworks, automatically instrumenting database calls, HTTP requests, and message queue operations without requiring you to modify code. For custom instrumentation, they provide SDKs that let you track specific functions or business transactions.
The pattern I see most often is teams implementing APM after they've already experienced major performance issues. That's backwards. APM gives you the most value when you establish baselines during normal operation, so you can quickly spot deviations.
Server and Infrastructure Monitoring
Server performance APM tracks the health of physical servers, virtual machines, and cloud instances. These tools monitor CPU utilization, memory usage, disk I/O, network traffic, and system processes. They alert you when resources are running low or when unusual patterns emerge.
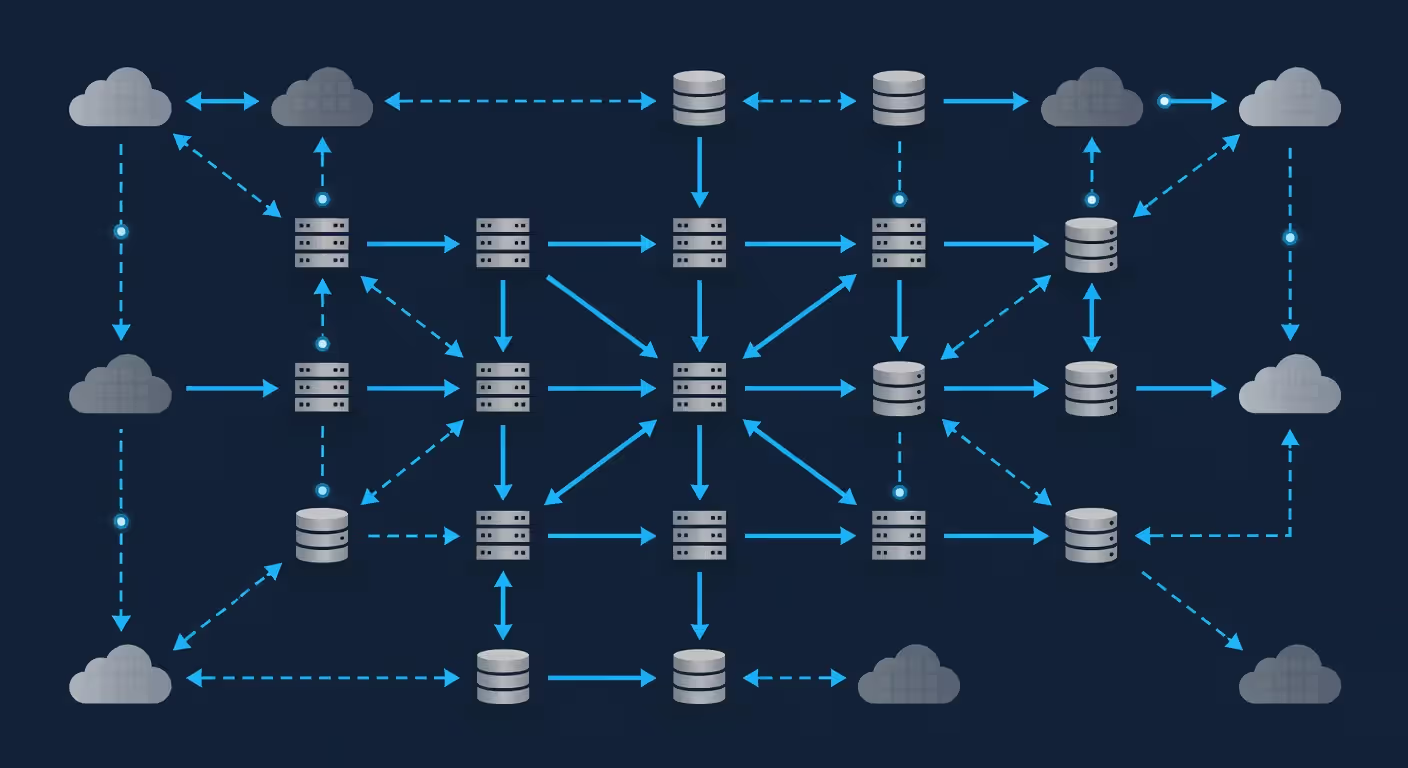
Infrastructure performance monitoring extends this to your entire environment—load balancers, firewalls, switches, storage systems, and cloud services. It maps dependencies between components so you understand how a database server problem might cascade to affect application performance.
Container and orchestration monitoring has become critical as more teams adopt Kubernetes and similar platforms. These tools track container resource consumption, pod health, cluster capacity, and scheduling patterns. They help you right-size container resources and spot when pods are being killed due to memory limits.
Cloud-native infrastructure monitoring integrates directly with AWS, Azure, and Google Cloud APIs to collect metrics about managed services—RDS databases, Lambda functions, S3 buckets, load balancers. This eliminates blind spots that traditional server monitoring can't cover.
Author: Damien Crowhurst;
Source: aleanetwork.net
End-User Experience Monitoring
End-user experience monitoring measures performance from your customers' perspective. It tracks real user interactions—page load times, JavaScript errors, AJAX call durations, and transaction completion rates—across different browsers, devices, and geographic locations.
Real User Monitoring (RUM) collects data from actual visitors using JavaScript embedded in your pages. It shows you the exact experience your users have, including problems that only occur on specific browsers or network conditions. Synthetic monitoring uses automated scripts that simulate user journeys at regular intervals, giving you consistent baseline measurements even when traffic is low.
This type of monitoring catches issues that backend tools miss. Your API might respond in 200ms, but if the browser takes 5 seconds to render the page due to bloated JavaScript or unoptimized images, users still have a terrible experience. End-user monitoring bridges that gap.
Key Features to Look for When Choosing APM Tools
Alerting capabilities separate useful tools from noise generators. You need flexible alert rules that let you set thresholds based on static values, dynamic baselines, or anomaly detection algorithms. The best platforms support alert routing—sending database alerts to your DBA team, application errors to developers, and infrastructure issues to operations.
Alert fatigue kills monitoring programs. Look for tools that let you suppress duplicate alerts, group related alerts, and escalate based on severity or duration. Integration with incident management platforms like PagerDuty or Opsgenie is non-negotiable for production environments.
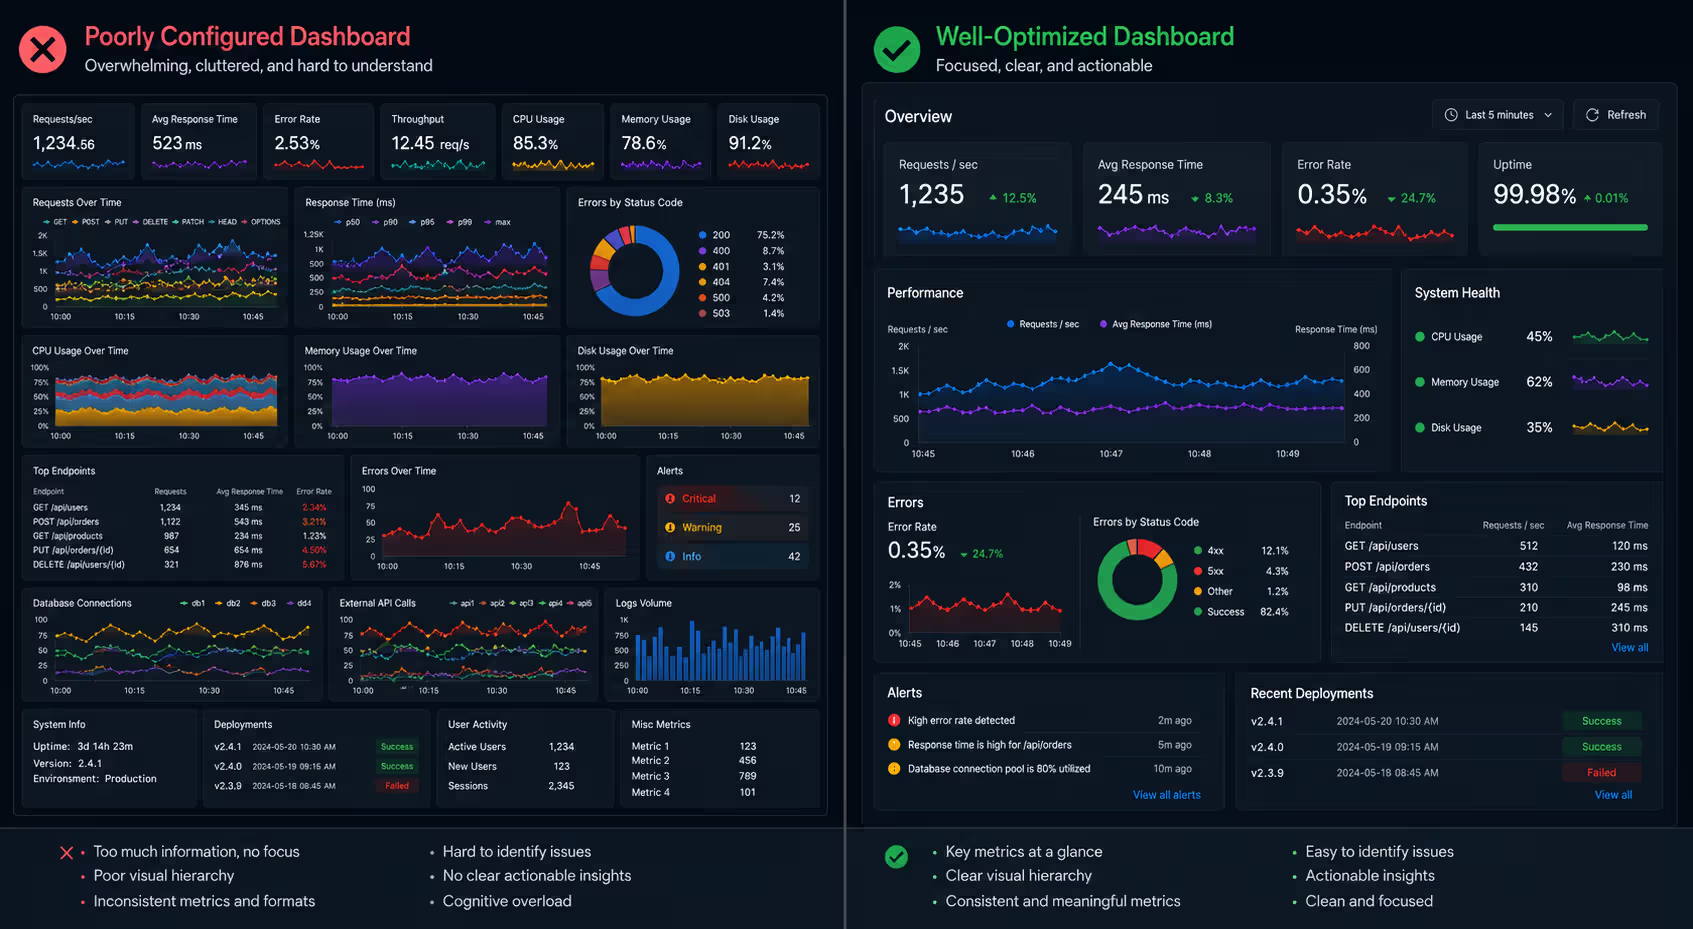
Dashboard customization matters more than you'd think. Pre-built dashboards are fine for getting started, but you'll need to create views tailored to different teams and use cases. Can you easily build dashboards that show business metrics alongside technical ones? Can you share dashboards with stakeholders who don't need access to the full platform?
Integration options determine how well your monitoring fits into existing workflows. Check for native integrations with your CI/CD pipeline, ticketing systems, communication tools (Slack, Teams), and configuration management platforms. API access lets you build custom integrations when you need them.
Scalability isn't just about handling more data—it's about maintaining query performance and alert responsiveness as you grow. Some tools that work beautifully for 10 servers become unusably slow at 1,000. Ask vendors about data retention limits, query performance at scale, and costs as you add more hosts or custom metrics.
Deployment models affect both cost and control. SaaS platforms are quickest to deploy and require no infrastructure management, but they send your data to vendor servers and charge based on usage. Self-hosted options give you complete control and predictable costs but require you to run and maintain the monitoring infrastructure yourself.
Reporting features help you communicate performance trends to stakeholders who don't live in dashboards. Look for scheduled reports, customizable time ranges, and the ability to export data for further analysis. Some tools offer SLA reporting that automatically calculates uptime percentages and availability metrics.
Author: Damien Crowhurst;
Source: aleanetwork.net
Common Mistakes When Implementing Performance Monitoring
Monitoring everything is just as bad as monitoring nothing. Teams often start by enabling every available metric, creating dashboards with 50 panels, and setting alerts on hundreds of thresholds. Within a week, they're ignoring most of it. Focus on the metrics that actually indicate problems—error rates, latency percentiles, resource saturation, and business-critical transaction performance.
Start with the Four Golden Signals: latency, traffic, errors, and saturation. Add more only when you have a specific question to answer or problem to diagnose. You can always add metrics later; removing noise is harder once teams have learned to ignore alerts.
Ignoring baseline metrics means you can't tell normal from abnormal. Before you set alert thresholds, run your monitoring for at least a week during typical usage patterns. Understand what "normal" looks like for your application during peak hours, off-hours, and during batch processing jobs. Set alerts based on deviations from these baselines, not arbitrary numbers.
Poor alert configuration creates two problems: too many false positives that train teams to ignore alerts, or thresholds set so high that you only find out about problems after users complain. Use multi-condition alerts that require multiple symptoms before firing. A single spike in response time might be nothing; a spike combined with increased error rates signals a real issue.
Lack of team training wastes your investment. Monitoring tools don't magically improve performance—people using the tools do. Make sure your team knows how to interpret dashboards, investigate alerts, and use advanced features like distributed tracing. Budget time for training and documentation.
Not integrating with incident response creates gaps where alerts fire but no one knows what to do. Your monitoring should automatically create tickets, page on-call engineers, and provide context about what's wrong. Document runbooks that link common alerts to investigation steps and remediation procedures.
Performance Monitoring Best Practices for Different Environments
Cloud versus on-premise monitoring requires different approaches. Cloud environments change constantly—instances spin up and down, IP addresses change, and auto-scaling creates or destroys resources based on demand. Your monitoring needs to handle this dynamism without manual configuration updates.
Use tag-based monitoring in cloud environments. Instead of monitoring specific servers by hostname, monitor groups defined by tags like "environment:production" or "service:checkout". When auto-scaling adds new instances, they automatically appear in the right monitoring groups. Cloud-native tools that integrate directly with your cloud provider's APIs make this seamless.
On-premise environments are more static but often more complex. You might have physical hardware that can't be easily replaced, legacy systems that don't support modern monitoring agents, and network segments that restrict communication. Plan for longer-lived hosts and more manual configuration.
Microservices architectures multiply complexity. A single user request might touch 20 different services, each with its own performance characteristics. Distributed tracing becomes mandatory—without it, you're guessing about where problems originate. Implement correlation IDs that follow requests across service boundaries, and make sure every service includes these IDs in logs and metrics.
Service mesh technologies like Istio provide automatic observability for microservices by intercepting all network traffic. They give you metrics, traces, and logs without instrumenting application code. The tradeoff is operational complexity—you're adding another layer to manage.
Containerized applications need both container-level and application-level monitoring. Track container resource usage (CPU, memory, network) to ensure you've allocated resources appropriately. But don't stop there—instrument the applications inside containers to understand their actual behavior. A container might look healthy while the application inside is failing.
Set resource limits on containers and monitor how often they're hit. Containers that frequently reach memory limits and get killed indicate under-provisioning. Containers that use 10% of their allocated resources indicate waste.
Hybrid infrastructures running workloads across on-premise data centers and multiple cloud providers need unified monitoring. The simpler option usually wins here—choose a platform that works everywhere rather than trying to stitch together cloud-specific tools. You need a single pane of glass to understand dependencies and trace requests that span environments.
Author: Damien Crowhurst;
Source: aleanetwork.net
Comparing Popular APM Solutions
Tool
Deployment
Pricing Model
Best Use Case
Key Strengths
Integration Ecosystem
Learning Curve
Datadog
SaaS
Per-host + custom metrics
Cloud-native applications, unified monitoring
Excellent visualization, broad integration support, infrastructure + APM in one platform
600+ integrations including all major cloud providers, databases, frameworks
Moderate—powerful but requires time to master
New Relic
SaaS
User-based or consumption-based
Full-stack observability, developer-focused teams
Strong APM capabilities, generous free tier, good distributed tracing
Deep integrations with popular frameworks, strong mobile app monitoring
Low—intuitive interface, good documentation
Dynatrace
SaaS or managed
Host-based or subscription
Enterprise environments, AI-driven insights
Automatic baselining, AI root cause analysis, minimal configuration
Enterprise-focused integrations, strong mainframe support
Moderate to high—powerful features require expertise
AppDynamics
SaaS or on-premise
Per-agent or subscription
Business transaction monitoring, application-centric view
Business transaction correlation, code-level diagnostics, strong Java support
Good enterprise integrations, business intelligence tools
High—complex setup, feature-rich
Prometheus + Grafana
Self-hosted
Open source (free)
Kubernetes environments, cost-conscious teams
Complete control, no vendor lock-in, powerful query language
Massive community support, works with everything via exporters
High—requires significant setup and maintenance
Elastic APM
SaaS or self-hosted
Subscription or free (self-hosted)
Teams already using ELK stack, log-centric monitoring
Unified with logging, good for trace analysis, flexible deployment
Native integration with Elasticsearch ecosystem
Moderate—easier if you know Elasticsearch
When comparing APM tools, consider your tech stack first. Teams running primarily on Java and .NET get more value from tools with deep support for those languages. If you're all-in on Kubernetes, Prometheus and Grafana might give you better visibility at lower cost.
Company size matters. Small teams benefit from tools with low operational overhead—SaaS platforms that don't require dedicated staff to maintain. Large enterprises often prefer solutions that offer on-premise deployment, dedicated support, and features like role-based access control and compliance certifications.
Budget drives many decisions. Open-source tools like Prometheus are free but require significant engineering time to deploy and maintain. SaaS platforms charge based on usage, which can become expensive as you scale but eliminates operational burden. Calculate total cost of ownership, not just licensing fees.
The biggest mistake I see teams make is implementing monitoring after they have a crisis. By then, you're trying to debug a problem without historical context or baselines. Start monitoring on day one of production—even basic metrics are better than nothing. You can always refine your approach, but you can't travel back in time to capture data you didn't collect.
— Chen Michael
FAQ: Performance Monitoring Questions Answered
What is the difference between APM and infrastructure monitoring?
APM focuses on application behavior—how your code executes, where it spends time, and what errors occur during transactions. It traces requests through your application stack and identifies code-level bottlenecks. Infrastructure monitoring tracks the health of servers, networks, and systems that run your applications—CPU usage, memory, disk I/O, and network throughput. You need both because an application can be slow due to inefficient code (APM territory) or because it's running on an overloaded server (infrastructure territory). Modern platforms often combine both capabilities.
How much do performance monitoring tools cost?
Pricing varies wildly based on deployment model and scale. SaaS platforms typically charge per host (ranging from $15 to $100+ per host per month) or per user. Some use consumption-based pricing tied to data volume or custom metrics. Open-source tools like Prometheus are free but require engineering time to deploy and maintain—budget for infrastructure costs and staff time. For a mid-sized company monitoring 50 hosts with APM and infrastructure monitoring, expect to spend $3,000 to $10,000 monthly on a commercial SaaS platform. Enterprise solutions for large deployments can reach six figures annually.
Can small businesses benefit from APM tools?
Absolutely. Small businesses often benefit more because they can't afford extended downtime or the reputation damage from poor performance. Many vendors offer free tiers or startup programs—New Relic's free tier, for example, includes basic APM for small deployments. Start with focused monitoring of your most critical application paths and revenue-generating features. You don't need enterprise features like advanced analytics or custom integrations right away. Even basic visibility into response times, error rates, and resource usage helps you catch problems before customers do.
What metrics should I monitor first?
Start with the Four Golden Signals: latency (how long requests take), traffic (how many requests you're handling), errors (rate of failed requests), and saturation (how full your resources are). For applications, track average and 95th percentile response times, error rates, and throughput. For infrastructure, monitor CPU utilization, memory usage, and disk space. For business-critical transactions like checkout or signup, track completion rates and transaction times separately. Don't try to monitor everything at once—begin with metrics that directly indicate customer-facing problems, then expand based on what you learn.
How do I know if my application has performance issues?
User complaints are the most obvious signal but the worst way to find out. Look for increasing response times—if your average API response time creeps from 200ms to 800ms over a few weeks, something's degrading. Watch error rates—a sudden spike or gradual increase indicates problems. Monitor resource saturation—if your database CPU consistently hits 90%, you're close to a failure. Compare current performance against historical baselines; most issues show up as deviations from normal patterns. Set up synthetic monitoring that simulates user journeys every few minutes—if these tests start failing or slowing down, you have an issue even if real users haven't reported it yet.
Do I need separate tools for cloud and on-premise monitoring?
Not necessarily, but it depends on your environment. Most modern monitoring platforms work across cloud and on-premise infrastructure, collecting metrics from both using agents or API integrations. Using a single tool simplifies operations and gives you unified visibility across your hybrid environment. However, if you're deeply invested in a specific cloud provider, their native monitoring tools (CloudWatch for AWS, Azure Monitor, Google Cloud Operations) might offer deeper integration and lower cost for cloud resources. The key is ensuring you can correlate data across environments—a slow application might be caused by on-premise database issues or cloud network latency, and you need visibility into both to diagnose it.
Performance monitoring isn't something you set up once and forget. Your applications evolve, your infrastructure changes, and new bottlenecks emerge as you scale. Start with focused monitoring of your most critical systems, establish baselines, and refine your approach based on what you learn. The tools you choose matter less than how you use them—even basic monitoring implemented well beats sophisticated platforms that nobody looks at.
Containerization packages applications with their dependencies into lightweight, portable units. This comprehensive guide explains how containers work, compares them to virtual machines, covers Docker and orchestration platforms, and shows you how to implement container-based deployment in modern DevOps workflows.
An API platform is the complete ecosystem that handles routing, security, lifecycle management, and governance for your APIs. Understand the core components—gateway, manager, portal, analytics—and learn how to evaluate platforms based on scalability, developer experience, and integration capabilities.
Comprehensive guide to test automation for QA teams. Covers automation frameworks, popular testing tools comparison, best practices for maintainable test suites, continuous testing in CI/CD pipelines, and common mistakes to avoid when implementing automated testing strategies.
Comprehensive guide to software testing covering testing lifecycle, manual vs automated approaches, functional and non-functional testing types, AI-powered testing tools, and common mistakes to avoid. Learn practical strategies for building quality into your development process.
The content on this website is provided for general informational and educational purposes only. It is intended to explain concepts related to AI tools, agents, developer infrastructure, coding assistants, APIs, and productivity workflows.
All information on this website, including articles, guides, and examples, is presented for general educational purposes. Outcomes and tool performance may vary depending on implementation, skill level, and use case.
This website does not provide professional AI consulting, development services, or guarantees of results, and the information presented should not be used as a substitute for consultation with qualified AI or software development professionals.
The website and its authors are not responsible for any errors or omissions, or for any outcomes resulting from decisions made based on the information provided on this website.