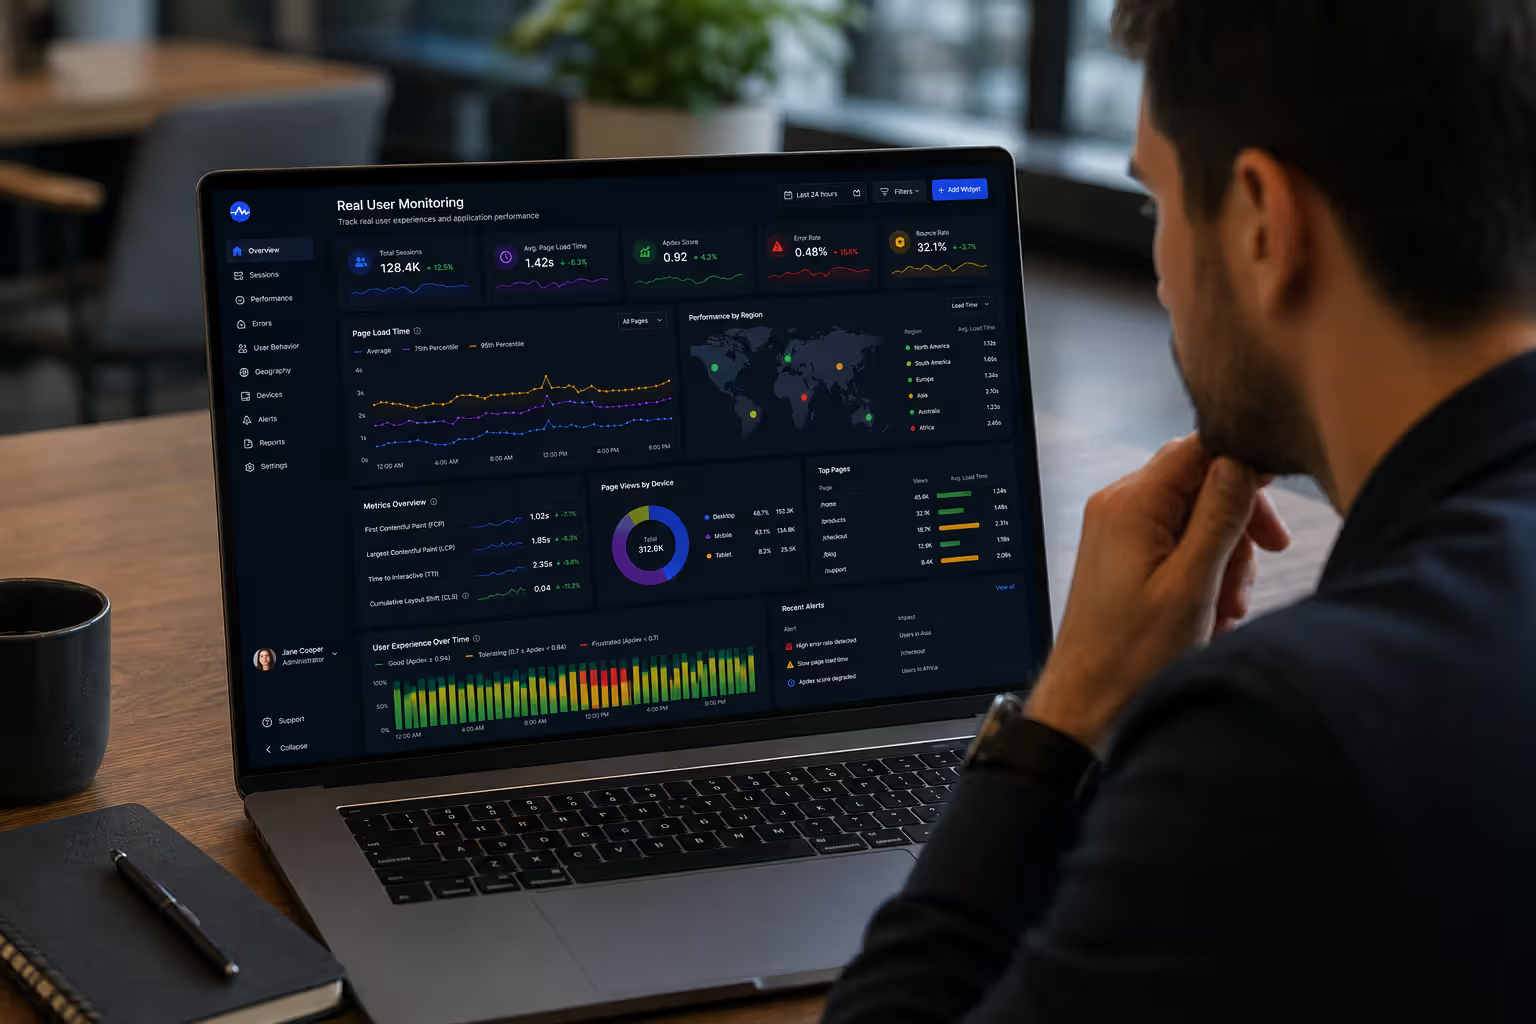
Understanding how your website performs for real users—not just in controlled tests—is the difference between guessing and knowing. Real user monitoring captures what actually happens when people visit your site: slow load times on mobile networks, JavaScript errors in specific browsers, performance drops during traffic spikes. This data comes from actual sessions, not simulations. And that changes everything about how you optimize.
What Is Real User Monitoring and How Does It Work
Real user monitoring (RUM) is a performance measurement technique that collects data from actual visitors as they interact with your website. Instead of simulating user behavior in a lab environment, RUM passively observes real sessions and sends performance metrics back to your analytics platform.
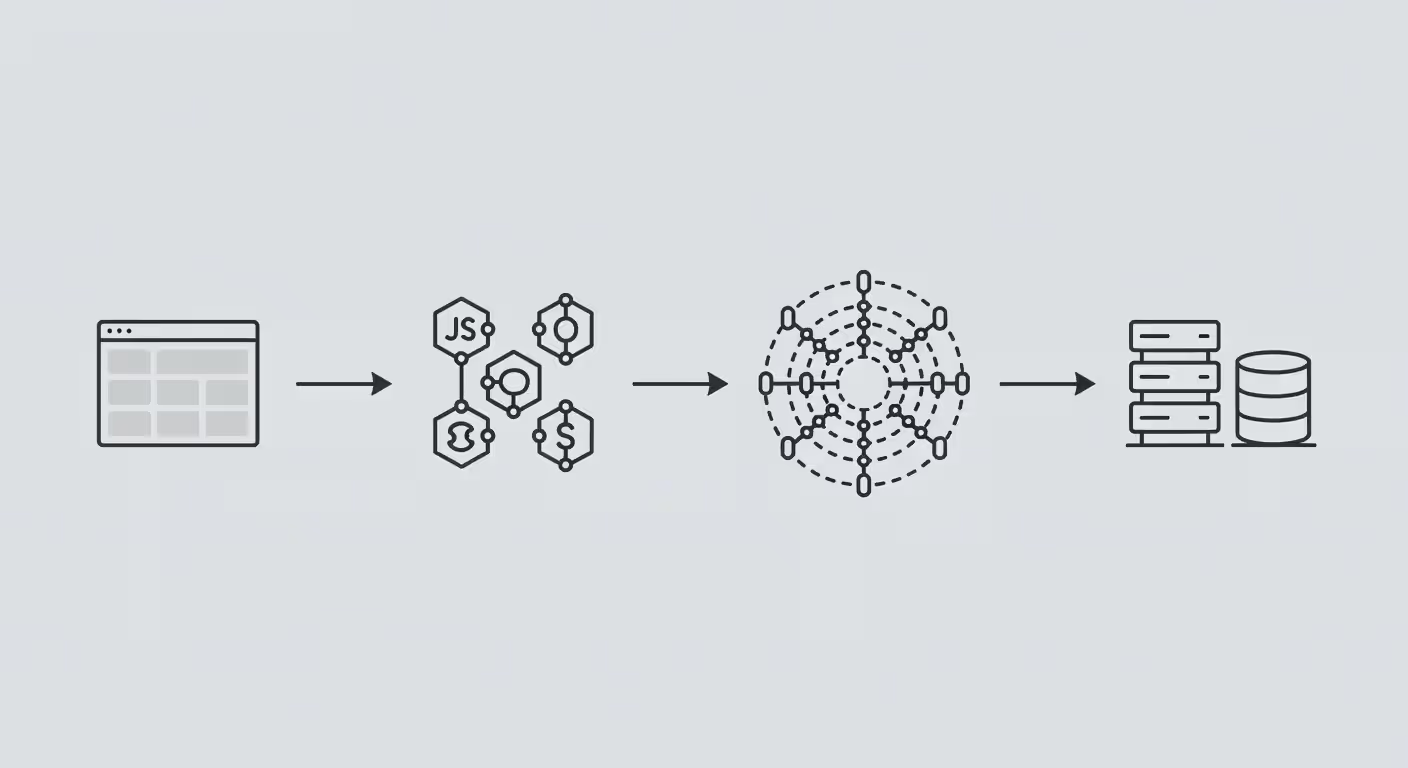
Here's how it works in practice. When someone loads your page, a small JavaScript snippet executes in their browser. This script taps into browser APIs—specifically the Navigation Timing API and Resource Timing API—to capture detailed performance data. Page load time. Time to first byte. DOM content loaded. First contentful paint. All measured in the user's actual environment.
The beauty of RUM is context. You're not just seeing that your homepage loads in 2.3 seconds. You're seeing it loads in 1.8 seconds for users in New York on Chrome desktop, but takes 4.7 seconds for mobile users in rural Texas on 4G connections. That specificity matters.
The data collection happens continuously during each user session. The RUM script monitors navigation timing, resource loading, user interactions, JavaScript errors, and custom business metrics you define. This information gets batched and transmitted to your RUM platform's servers, typically using beacons that don't block page rendering.
What metrics does RUM actually capture? The core web vitals—Largest Contentful Paint (LCP), First Input Delay (FID), and Cumulative Layout Shift (CLS)—are standard. But you'll also get time to interactive, total blocking time, resource waterfall data, Ajax call performance, and error rates. Many RUM tools let you track custom events too: checkout completion times, search result latency, video playback quality.
Author: Adrian Westmere;
Source: aleanetwork.net
The pattern I see most often is teams implementing RUM and immediately discovering their performance problems aren't what they thought. That expensive CDN migration? Barely moved the needle for 80% of users. The image optimization project everyone delayed? Turns out it would've had massive impact.
Real User Monitoring vs Synthetic Monitoring
These two approaches measure performance from completely different angles. Synthetic monitoring uses automated scripts to simulate user visits from controlled locations at regular intervals. Think of it as a robot checking your site every five minutes from specific cities, always using the same browser, same network conditions.
Real user monitoring, by contrast, captures data from actual humans visiting your site. Every device. Every browser version. Every network type. Every geographic location. It's messy, variable, and exactly what your users experience.
Feature
Real User Monitoring
Synthetic Monitoring
Data source
Actual visitor sessions
Scripted automated tests
Coverage
All users, devices, locations
Predefined locations and scenarios
Cost
Scales with traffic volume
Fixed cost based on test frequency
Use cases
Understanding real experience, identifying trends
Proactive alerting, benchmarking, API monitoring
Limitations
Requires traffic to generate data
Doesn't capture real user diversity
Setup complexity
Moderate (add script, configure)
Higher (write scripts, maintain tests)
Real-time insights
Yes, as users visit
Yes, on test schedule
Synthetic monitoring excels at catching problems before users do. You can test from locations where you don't have traffic yet. You can monitor checkout flows at 3 AM when no one's buying. You can establish performance baselines and get alerted when things degrade.
But synthetic monitoring can't tell you how your site performs for users on older Android phones with spotty connections. It won't show you that Safari 15 users are experiencing a JavaScript error that Chrome users never see. It can't reveal that your performance is fine in most places but terrible in Southeast Asia.
When to Use RUM vs Synthetic Monitoring
The simple answer? Use both. They complement each other.
Deploy synthetic monitoring for proactive alerts and baseline tracking. Set up tests from key geographic markets. Monitor critical user journeys—login, search, checkout—every few minutes. When something breaks, you'll know before customers complain.
Use real user monitoring to understand actual user experience and prioritize optimization work. RUM data tells you where your performance problems hurt the most users. It shows you which device types struggle. It reveals how business metrics correlate with technical performance.
Start with RUM if you already have meaningful traffic and need to understand current user experience. Start with synthetic if you're launching a new site, need pre-deployment testing, or want monitoring before you have users.
A common mistake is treating these as competing solutions. They're not. Synthetic monitoring is your early warning system. RUM is your reality check.
How Real User Monitoring Collects Data
The technical mechanics of RUM data collection are surprisingly straightforward. It starts with a JavaScript snippet—usually a few kilobytes—that you add to your site's HTML, typically in the section or just before the closing tag.
When a page loads, this script initializes and immediately starts listening. The browser's Performance API provides most of the raw data. performance.timing gives navigation timing information. performance.getEntriesByType('resource') returns details about every resource the page loaded—images, scripts, stylesheets, fonts.
Author: Adrian Westmere;
Source: aleanetwork.net
For modern metrics like Core Web Vitals, the script uses the PerformanceObserver interface. This API lets the RUM script watch for specific performance entries—like layout shifts or long tasks—as they occur. When a layout shift happens, the observer fires, captures the data, and queues it for transmission.
User interactions get tracked through event listeners. The RUM script might monitor click events, form submissions, or route changes in single-page applications. Custom instrumentation lets you track business-specific events: "user completed video," "search returned results," "filter applied."
Data transmission happens through beacons—small HTTP requests that carry performance data back to the RUM platform's collection endpoints. Most RUM tools use the Beacon API (navigator.sendBeacon()) when available because it's non-blocking and works even if users navigate away quickly.
Privacy considerations matter here. Good RUM implementations anonymize user data by default. IP addresses get truncated. Personal information from URLs or form fields gets stripped. Most platforms let you configure exactly what data gets collected and provide mechanisms to respect user consent preferences.
The data pipeline typically works like this: collect metrics in the browser, batch them to reduce network overhead, compress the payload, transmit via beacon, process on the server side, aggregate for analysis, and make available through dashboards and APIs.
Sampling is common for high-traffic sites. Instead of collecting data from every single session, you might sample 10% or 20%. This reduces costs while still providing statistically significant insights. The key is ensuring your sample is representative—random selection across all user segments.
Setting Up Real User Monitoring for Your Website
Implementation doesn't require a complete infrastructure overhaul. Most teams can get basic RUM running in under an hour.
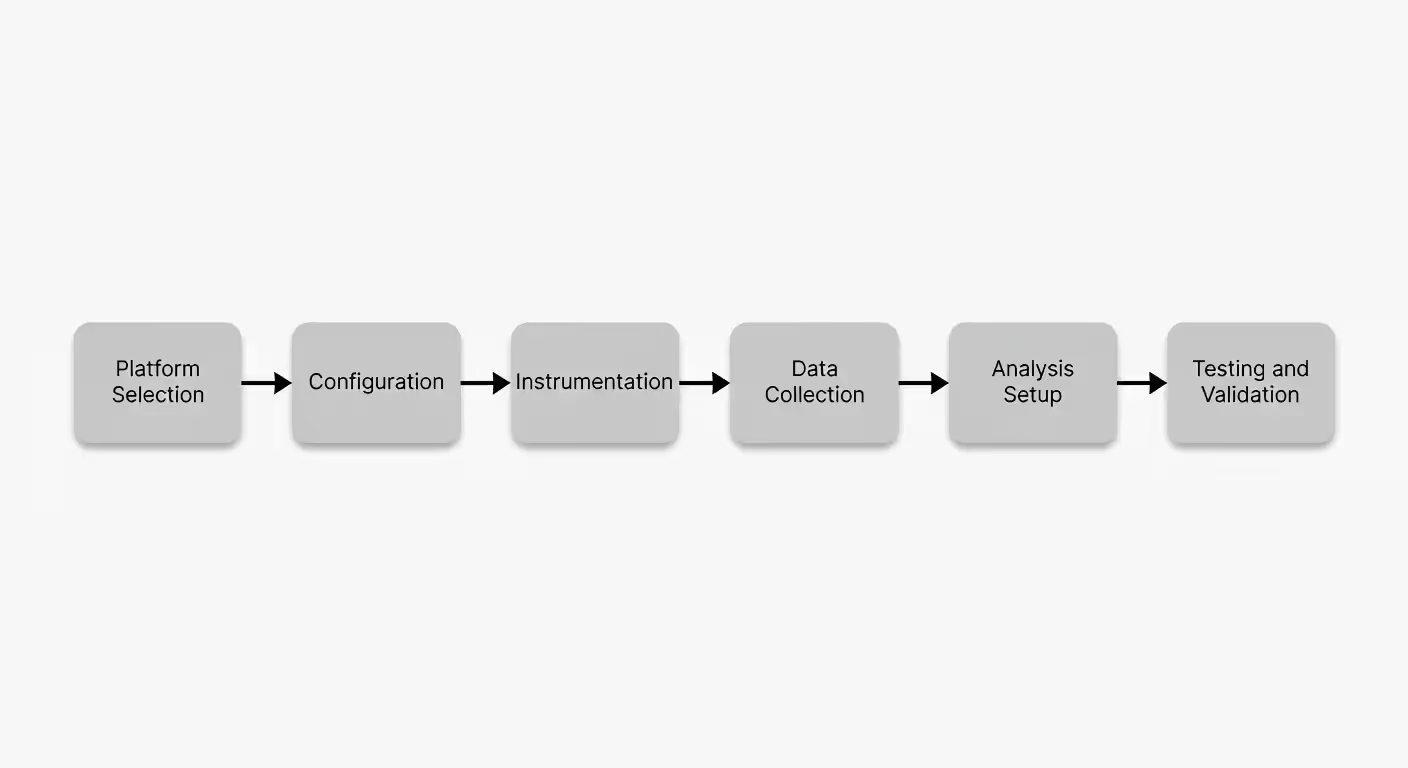
First, choose your RUM platform. You'll evaluate options in the next section, but for setup purposes, you'll need an account and your monitoring snippet. Every RUM tool provides a JavaScript tag—sometimes called an agent or beacon—unique to your account.
Add this snippet to your site's HTML. The placement matters. Putting it in the `` section, as early as possible, ensures the RUM script loads before most other resources and can capture complete timing data. Some teams use tag management systems like Google Tag Manager for this, which works but can introduce slight delays.
For single-page applications, you'll need a few extra steps. Most modern RUM tools provide framework-specific SDKs for React, Vue, or Angular. These integrate with your router to track route changes as distinct page views and properly capture performance data for client-side navigation.
Configure your baseline settings. Define what you want to track beyond default metrics. Set up custom events if needed. Configure sampling rates if you're dealing with high traffic volumes. Establish geographic regions or user segments for analysis.
Test your implementation before going live. Most RUM platforms offer a test mode or staging environment. Generate some traffic, check that data appears in your dashboard, verify that metrics look reasonable. Look for your site in the platform's session replay or waterfall views.
Common setup mistakes? Not excluding internal traffic, which skews your data. Forgetting to handle user consent for privacy regulations. Setting sampling rates too low and losing statistical significance. Not configuring error tracking, which is half the value of RUM.
Validation takes a few days. You need enough data to establish patterns. Watch for anomalies—if 90% of your users suddenly appear to be on Antarctica, something's wrong with geolocation. Compare RUM data against your existing analytics to sanity-check traffic volumes.
Author: Adrian Westmere;
Source: aleanetwork.net
The setup doesn't end at deployment. You'll refine alert thresholds as you understand your baseline performance. You'll add custom metrics as you identify business-critical user journeys. You'll adjust sampling as traffic patterns change.
Popular Real User Monitoring Tools Compared
The RUM market has consolidated around a few major players, each with different strengths.
Google Analytics 4 now includes basic RUM capabilities through its Web Vitals report. It's free, integrates with your existing GA4 setup, and covers Core Web Vitals. But it's limited—no detailed resource timing, minimal customization, and basic alerting. Good for small sites or teams just starting with performance monitoring.
Datadog Real User Monitoring offers deep integration with their broader observability platform. If you're already using Datadog for infrastructure or APM, adding RUM creates a unified view from server to browser. Pricing scales with sessions, typically starting around $1.50 per thousand sessions. Strong for teams that want correlated backend and frontend data.
New Relic Browser provides session replay, detailed error tracking, and excellent single-page application support. Their pricing model changed in 2025 to consumption-based, which can get expensive for high-traffic sites but works well for moderate volumes. The session replay feature helps debug issues that metrics alone can't explain.
Sentry Performance combines error tracking with RUM. If you're already using Sentry for error monitoring—and many teams are—adding performance monitoring is straightforward. Pricing is competitive, and the error-to-performance correlation is genuinely useful. Weaker on business metric tracking compared to dedicated RUM tools.
Cloudflare Web Analytics offers a lightweight, privacy-focused option that doesn't require cookies or collecting personal data. It's free for Cloudflare customers and provides basic RUM metrics. Limited compared to full-featured platforms, but the privacy angle matters for some organizations.
Selection criteria depend on your needs. High-traffic sites prioritize sampling flexibility and cost predictability. Developer-heavy teams want detailed error tracking and session replay. Enterprise organizations need robust alerting and integration with existing tools.
Don't overlook the data retention policies. Some platforms keep detailed session data for 30 days, aggregated data for 90 days. Others offer longer retention at higher price tiers. If you're doing month-over-month trend analysis, this matters.
Best Practices for Real User Monitoring
Getting value from RUM isn't just about collecting data—it's about collecting the right data and acting on it.
Start with sampling strategy. For sites with millions of monthly visitors, monitoring every session is expensive and unnecessary. A 10% sample of 5 million users still gives you 500,000 data points—more than enough for statistical significance. The trick is ensuring your sample represents all user segments proportionally. Avoid sampling that overrepresents desktop users or underrepresents specific geographic regions.
Set performance budgets. RUM data should inform concrete thresholds. Maybe you decide LCP must stay under 2.5 seconds for 75% of users. Or JavaScript errors can't exceed 0.5% of sessions. These budgets give your team clear targets and make performance a measurable goal, not a vague aspiration.
Configure intelligent alerts. Don't just alert on absolute thresholds. Use anomaly detection—when performance degrades 30% compared to the previous week, that's worth investigating even if you're still within budget. Alert on error rate spikes. Alert on performance degradation for specific user segments, like mobile users or users from key markets.
Synthetic testing tells you what's possible. Real user monitoring tells you what's actual. You need both, but if I had to choose one, I'd choose the truth of what real users experience every time.
— Souders Steve
Segment your analysis. Aggregate metrics hide problems. Your overall page load time might look fine, but when you segment by device type, you discover mobile users wait twice as long. Or performance is great everywhere except Brazil. Or Safari users see error rates 5x higher than Chrome. Always slice your data multiple ways.
Correlate with business metrics. The point isn't just faster pages—it's better business outcomes. Connect RUM data to conversion rates, bounce rates, revenue per session. When you can say "reducing LCP by 0.5 seconds increased conversions by 8%," you've got a compelling case for performance investment.
Common mistakes to avoid? Monitoring everything without prioritizing what matters. Ignoring the long tail of performance—the slowest 10% of users often represent your most challenging markets or use cases. Setting up RUM but never reviewing the data. Optimizing for metrics that don't impact user experience or business results.
Establish team workflows. RUM data should feed into regular performance reviews. Weekly check-ins to spot trends. Post-deployment monitoring to catch regressions. Quarterly deep dives to identify optimization opportunities. Without process, the data just sits there.
Mind the overhead. Yes, RUM scripts add a small performance cost. Most modern RUM tools add 10-30 KB and execute asynchronously, so the impact is minimal. But if you're loading five different monitoring scripts, that adds up. Consolidate where possible.
Using RUM Data to Improve User Experience
Raw data doesn't improve anything. Analysis and action do.
Start by establishing your baseline. What's your median LCP? Your 75th percentile? Your 95th percentile? The 95th percentile matters because it shows what your slowest users experience—often your most valuable or challenging market segments.
Identify patterns in poor performance. Sort sessions by slowest LCP and look for commonalities. Are they all mobile users? Specific geographic regions? Particular browsers or operating systems? Certain entry pages? These patterns point to root causes.
Author: Adrian Westmere;
Source: aleanetwork.net
Use session replay to understand context. Numbers tell you there's a problem. Session replay shows you what users experienced. You might discover that your LCP is slow because a hero image loads late, or that layout shifts happen when ads load, or that users abandon forms because they're unresponsive.
Prioritize fixes based on impact. Calculate how many users each issue affects and how severely. A problem that impacts 2% of users isn't worth the same effort as one affecting 40%. Use RUM data to build a business case: "Fixing mobile image loading will improve LCP for 35% of our traffic, which correlates with a projected 12% increase in mobile conversions."
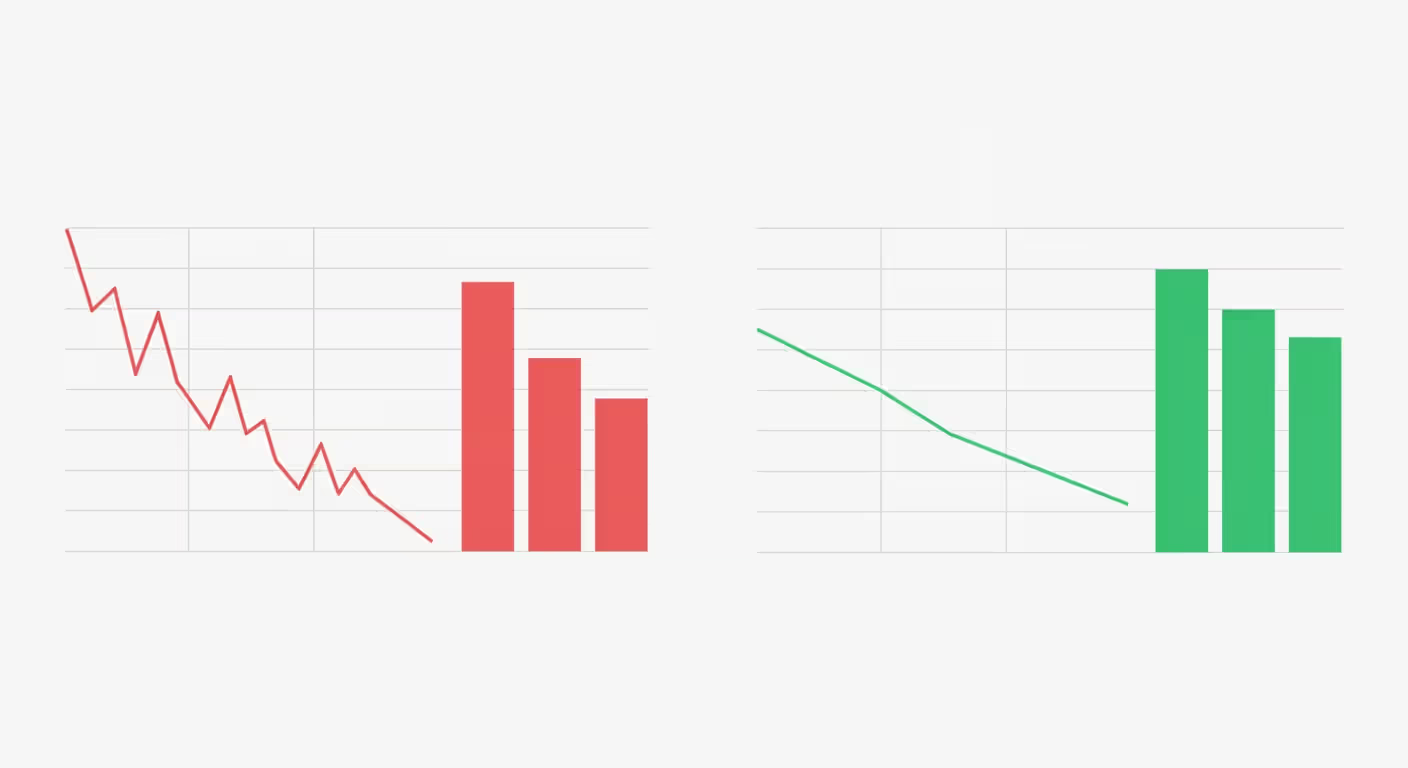
The feedback loop is critical. Make a change. Monitor RUM data for the affected segment. Measure the impact. A good RUM platform lets you compare performance before and after deployments, either through annotations or A/B testing features.
Real example: An e-commerce site noticed through RUM that their product pages had terrible LCP on mobile—4.8 seconds at the 75th percentile. Digging into the data, they found the culprit was a large hero image. They implemented responsive images with proper sizing and lazy loading. Two weeks later, RUM showed mobile LCP dropped to 2.1 seconds. Conversion rate for mobile product pages increased 11%.
Watch for unintended consequences. Sometimes optimizations help one metric but hurt another. You might improve LCP by lazy-loading images, but if you're too aggressive, you'll increase CLS as images pop in. RUM data shows these trade-offs.
Track error patterns too. JavaScript errors often correlate with poor user experience and lost revenue. RUM tools can group errors by type, show you which errors affect the most users, and provide stack traces for debugging. An error that fires on every page load for 5% of users is a bigger priority than one that affects 0.1% of users on a rarely-visited page.
Set up custom events for key user journeys. Track how long search takes. Monitor checkout flow performance. Measure video playback quality. These business-specific metrics often matter more than generic page load times.
The goal isn't perfect metrics. It's continuous improvement. Use RUM data to spot problems, understand their impact, prioritize fixes, and validate improvements. Then repeat.
Feature
Real User Monitoring
Synthetic Monitoring
Data source
Actual visitor sessions
Scripted automated tests
Coverage
All users, devices, locations
Predefined locations and scenarios
Cost
Scales with traffic volume
Fixed cost based on test frequency
Use cases
Understanding real experience, identifying trends
Proactive alerting, benchmarking, API monitoring
Limitations
Requires traffic to generate data
Doesn't capture real user diversity
Setup complexity
Moderate (add script, configure)
Higher (write scripts, maintain tests)
Real-time insights
Yes, as users visit
Yes, on test schedule
FAQ: Real User Monitoring Questions Answered
What is the difference between RUM and APM?
Real User Monitoring focuses on frontend performance—what happens in the user's browser. Application Performance Monitoring (APM) tracks backend performance—server response times, database queries, API calls. They're complementary. RUM tells you the page loaded slowly; APM tells you it was because a database query took 3 seconds. Many platforms now offer both, giving you end-to-end visibility from server to browser.
Does real user monitoring slow down my website?
The performance impact is minimal when implemented correctly. Most RUM scripts are 10-30 KB, load asynchronously, and execute without blocking page rendering. They typically add less than 50 milliseconds to page load time. The key is using a single, well-optimized RUM solution rather than loading multiple monitoring scripts. Good RUM tools are designed to observe performance without degrading it.
How much does real user monitoring cost?
Pricing varies widely based on traffic volume and features. Free options like Google Analytics 4 Web Vitals cover basics but lack depth. Paid platforms typically charge per thousand sessions, ranging from $1 to $5 per thousand depending on features and retention. A site with 1 million monthly sessions might pay $1,000-$3,000 monthly for a full-featured RUM platform. High-traffic sites negotiate custom pricing and use sampling to control costs.
What metrics should I track with RUM?
Start with Core Web Vitals—Largest Contentful Paint, First Input Delay (or Interaction to Next Paint as of 2024), and Cumulative Layout Shift. These directly impact SEO and user experience. Add page load time, time to interactive, and error rates. Then layer in business-specific metrics: search latency, checkout completion time, video playback quality. Don't track everything; focus on metrics that correlate with user satisfaction and business outcomes.
Is real user monitoring GDPR compliant?
RUM can be GDPR compliant, but implementation matters. Choose a platform that anonymizes data by default—truncating IP addresses, stripping personal information from URLs, avoiding cookies when possible. Respect user consent preferences; some organizations only enable RUM for users who've consented to analytics. Document what data you collect and why. Privacy-focused options like Cloudflare Web Analytics don't collect personal data at all, making compliance simpler.
How long does it take to implement RUM?
Basic implementation takes 30-60 minutes—create an account, add the monitoring snippet to your site, configure basic settings. You'll see initial data within hours. Full implementation with custom events, proper segmentation, alert configuration, and team training might take a week. Single-page applications require framework-specific setup that adds complexity. The bigger time investment isn't technical setup; it's establishing processes to actually use the data for optimization.
Real user monitoring transforms performance optimization from guesswork into data-driven decision making. You'll stop arguing about whether the site feels slow and start discussing why mobile users in specific regions experience 3-second delays. The tools are mature, implementation is straightforward, and the insights are actionable. Start with basic metrics, establish your baseline, and let real user data guide your optimization priorities. Your users' actual experience is the only metric that ultimately matters.
Containerization packages applications with their dependencies into lightweight, portable units. This comprehensive guide explains how containers work, compares them to virtual machines, covers Docker and orchestration platforms, and shows you how to implement container-based deployment in modern DevOps workflows.
Performance monitoring tools track application response times, server health, and infrastructure metrics to catch problems before users notice. This guide covers how monitoring works, types of tools available, key features to evaluate, and common implementation mistakes to avoid.
An API platform is the complete ecosystem that handles routing, security, lifecycle management, and governance for your APIs. Understand the core components—gateway, manager, portal, analytics—and learn how to evaluate platforms based on scalability, developer experience, and integration capabilities.
Comprehensive guide to test automation for QA teams. Covers automation frameworks, popular testing tools comparison, best practices for maintainable test suites, continuous testing in CI/CD pipelines, and common mistakes to avoid when implementing automated testing strategies.
The content on this website is provided for general informational and educational purposes only. It is intended to explain concepts related to AI tools, agents, developer infrastructure, coding assistants, APIs, and productivity workflows.
All information on this website, including articles, guides, and examples, is presented for general educational purposes. Outcomes and tool performance may vary depending on implementation, skill level, and use case.
This website does not provide professional AI consulting, development services, or guarantees of results, and the information presented should not be used as a substitute for consultation with qualified AI or software development professionals.
The website and its authors are not responsible for any errors or omissions, or for any outcomes resulting from decisions made based on the information provided on this website.